Basic usage
Install
Required packages
Python >= 3.6
numpy == 1.18.5
matplotlib == 3.2.2
scipy == 1.5.0
scikit-learn == 0.23.1
Install procedures
From
PyPI(recommended)$ pip3 install aiphad
Required packages such as NumPy will also be installed at the same time.
If you add the
--useroption, it will be installed under the user’s home directory$ pip3 install --user aiphad
From source (for developers)
Download or clone the github repository
$ git clone https://github.com/
Install
$ cd aiphad
$ pip3 install --user ./
Uninstall
Execute the following command.
$ pip uninstall aiphad
Structures of AIPHAD
AIPHAD is structured as follows (up to the third level is displayed).:
|--aiphad
|    |--aiphad.pdc_sampler
|    |    |--fit
|    |    |--us
|    |    |--cross_selection
|    |    |--make_data
|    |    |--make_label
|    |    |--preprocessing
|    |    |--calculate
|    |    |--postprocessing
|    |    |--us_*
Each module is created as follows.
aiphad.pdc_sampler.fit: Phase estimation moduleaiphad.pdc_sampler.us: Uncertanty score moduleaiphad.pdc_sampler.cross_selection: Module for the fixed one variableaiphad.pdc_sampler.make_data: Data loading moduleaiphad.pdc_sampler.make_label: Label preparation moduleaiphad.pdc_sampler.preprocessing: Preprocessing moduleaiphad.pdc_sampler.calculate: Module to calculate label propagation or label spreadingaiphad.pdc_sampler.postprocessing: Postprocessing moduleaiphad.pdc_sampler.us_*: Module to calculate uncertainty score depending on the methods(in*, LC, MS, EA, or RS are assigined.)
The detail of module is shown in API Reference.
Calculation flow in PDC
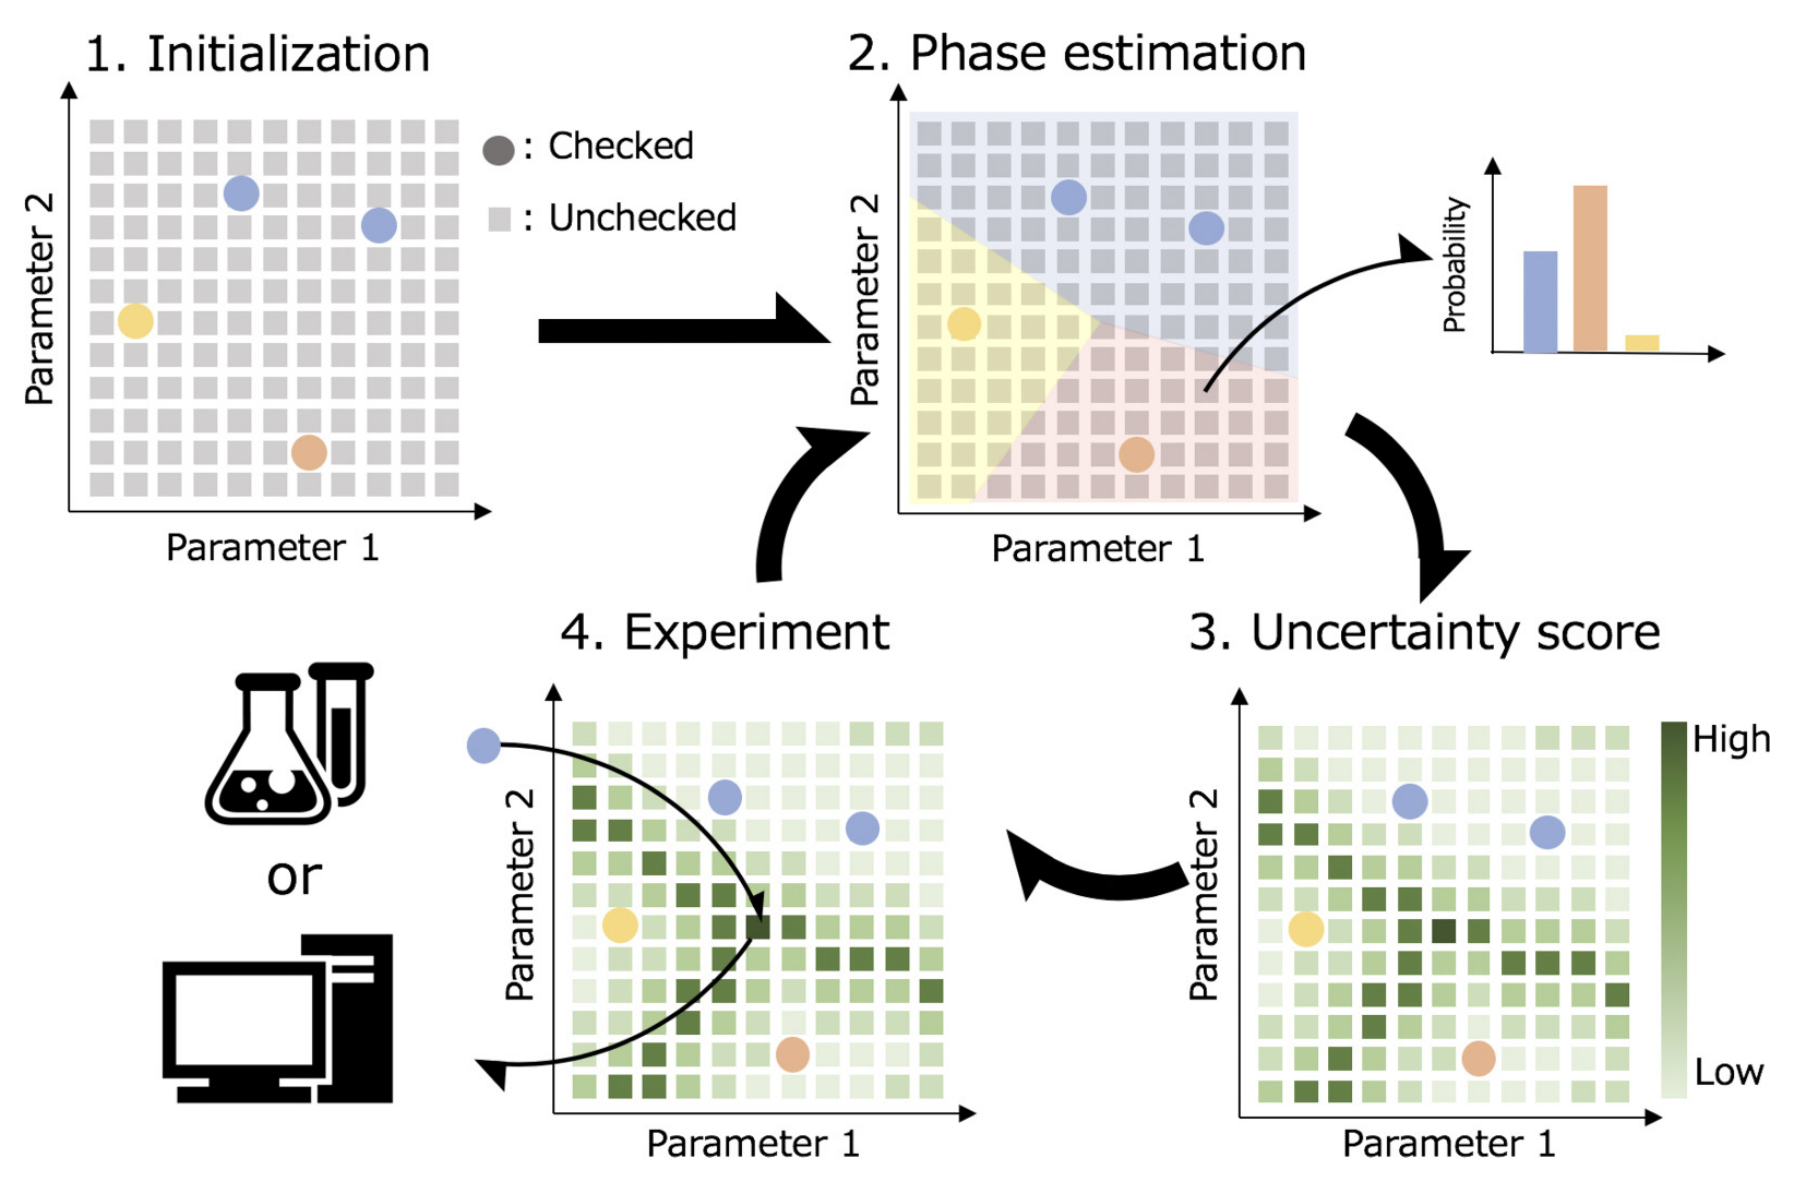
The PDC algorithm can reduce the number of experiments needed to investigate phase diagrams, and also allows for efficient discovery of unknown phases. The PDC algorithm performs uncertainty sampling according to the following procedure. The detals of each procedure is explained in Tutorial and API Reference.
Define the region of the phase diagram
The parameter space to investigate the phase diagram is defined, and this parameter space is descretized. The number of descretized points in the phase diagram is \(N\). If the experiments for \(N\) experimental conditions are finished, the phase diagram is completely obtained. When the position vector in the phase diagram is defined as \(\mathbf{x} \in \mathbb{R}^d\), the candidates of experimental conditions is represented as \(\mathbf{\{ x_\it i \}_{i= \rm 1,\ldots ,N} }\). Here, the arbitrary dimensiion of phase diagram \(d\) can be used in PDC algorithm.
We consider the case that, from \(N\) candidates, the experiments for \(M\) candidates were finished, and the types of phases at the \(M\) expereimental conditions were identified. The types of phases found at this stage are assigned integer indexes as a label for training. For example, if the number of the found phases is \(P\), the indexes of labels are defined as \(p = 1, \ldots ,P\). Here, for the experimental conditions that have not yet been performed, the label \(-1\) is assigned.
Phase estimation
For each point in the phase diagram that has not yet been identified, the belonging probability \(P(p|\mathbf{x})\) to the phase which are already found is estimated. Here, the label propagation method is used, and PDC algorithm can select the method from the following two methods:
LP: label propagation method
LS: label spreading method
The label of a point for which a phase is already identified is not changed in LP, whereas in LS , the label can change depending on the surrounding environment.
Using this probability \(P(p|\mathbf{x})\), an estimated phase diagram can be obtained if the phase with the maximum probability at each point is regarded as the estimated phase.
Uncertainty score
Using \(P(p|\mathbf{x})\), an uncertainty score is calculated. The point with the largest uncertainty score (the most uncertain point in the phase diagram) is proposed as a candidate point for the next experimental condition. In PDC, the following four types of uncertainty scores are available.
LC: least confident method ( \(1-P(p_1|\mathbf{x})\) )
EA: entropy-based approach method ( \(1-[P(p_1|\mathbf{x})-P(p_2|\mathbf{x})]\) )
MS: margin sampling method ( \(- \sum_{p} P(p|\mathbf{x})\log {P(p|\mathbf{x})}\) )
RS: random sampling method
Here, \(P(p_1|\mathbf{x})\) and \(P(p_2|\mathbf{x})\) are the largest and second largest probability at each point. Multiple candidates can also be proposed.
Experiment
The phase is identified by performing an experiment on the points selected in Step 3. The index of the identified phase is assighned from \(p = 1, \ldots ,P\). If a new phase is explored, an index representing the new phase is added as \(p = 1, \ldots ,P, P + 1\), and \(P + 1\) is specified as the label of new data.
The new data adds to the training data, and by repeating Steps 2 to 4, efficiently investigation of a phase diagram can be performed. The above flow is illustrated following figure.
